Lucy
Ask the AI Tutor
Need help with Year 2 Data Handling - Answering Questions? Ask our AI Tutor!
Lucy AI Tutor - Lucy
Connecting with Tutor...
Please wait while we establish connection
Lucy
Hi! I'm Lucy, your AI tutor. How can I help you with Year 2 Data Handling - Answering Questions today?
now
Logo

Maths Quiz - Year 2 Data Handling - Answering Questions (Questions)

Read charts and pictograms like a detective. Spot words such as total and how many more, then use the data to choose and explain your answer.

Explore the Topic →
(quiz starts below)

Fascinating Fact:

Read the question twice. Be a detective with a magnifying glass. Spot words like total, most, least, how many more.

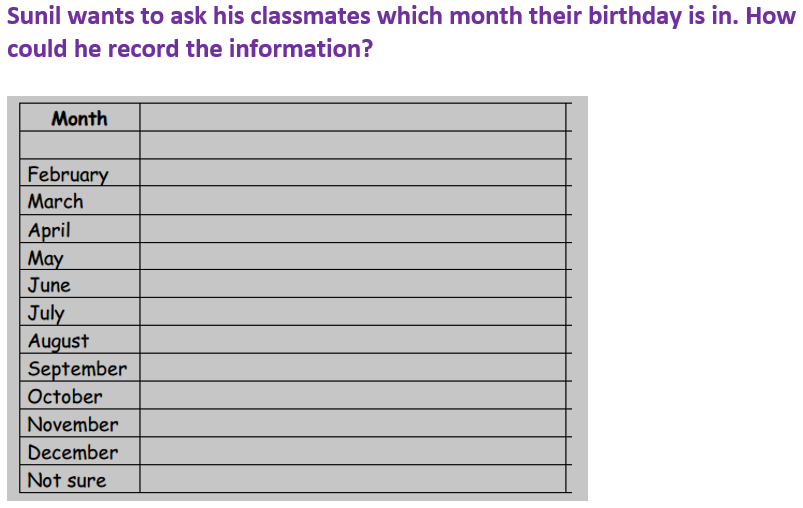
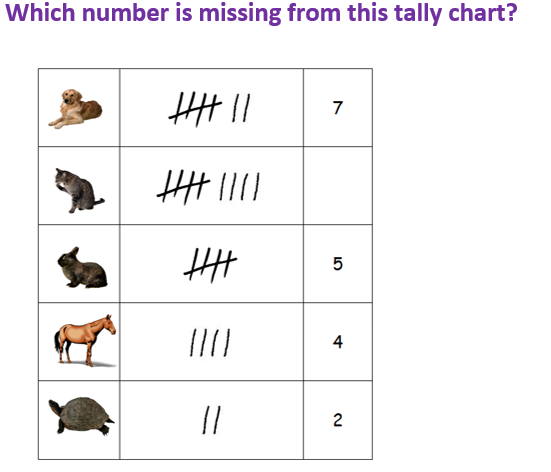
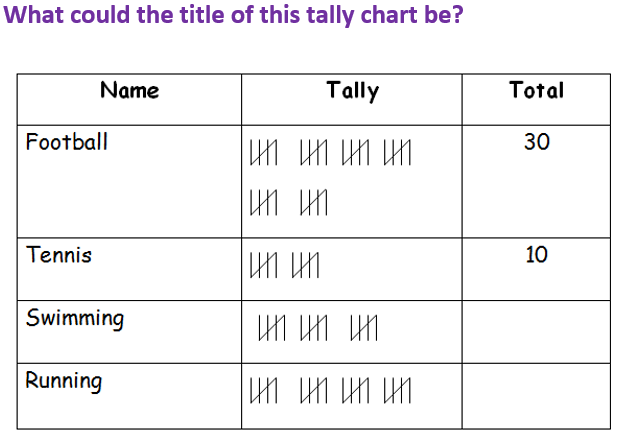
In KS1 Maths, children answer questions about data shown in tallies, pictograms, tables, and simple bar charts. They read the key or scale, compare categories, and work out totals and differences.

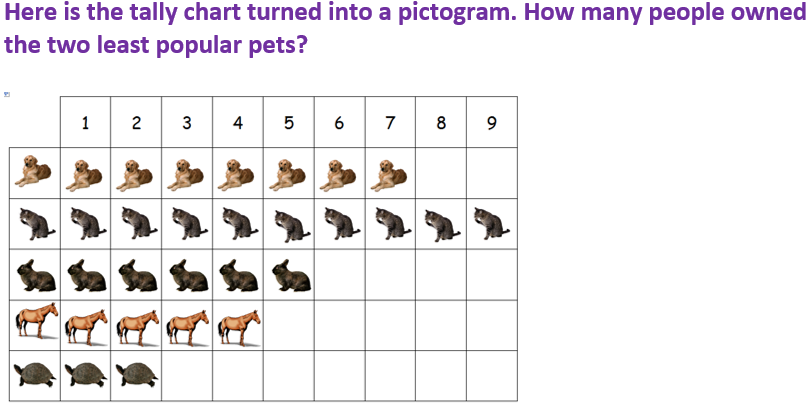
  • Pictogram: A chart that uses small pictures. The key tells you what each picture is worth.
  • Bar Chart: A chart with bars to show how many. Taller bars mean more.
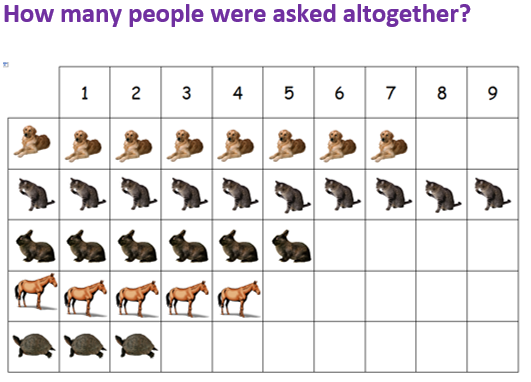
  • Total / Difference: Total means add everything. Difference asks “how many more” or “how many fewer”.

Warm up with a quick activity: try the Numeracy Game before you start the quiz.

How do I read a KS1 pictogram correctly?

Start with the key to see what each picture is worth. Count carefully, then use the totals to answer questions like most, least, or how many more.

What does “how many more” mean in data questions?

“How many more” asks for the difference. Subtract the smaller amount from the larger, for example 9 cars and 6 bikes means 9 − 6 = 3 more cars.

How can children check answers in bar charts?

Re-read the question, trace the bars to the numbers on the scale, and compare again. If using a key or scale, check it twice.

1.
[ ] By remembering what they say
[ ] By tallying on the chart
[ ] By only asking the girls
[ ] By writing a story
2.
[ ] 7
[ ] 5
[ ] 4
[ ] 9
3.
[ ] 6
[ ] 4
[ ] 9
[ ] 8
4.
[ ] 25
[ ] 27
[ ] 20
[ ] 32
5.
[ ] 1
[ ] 6
[ ] 4
[ ] 9
6.
[ ] 16
[ ] 12
[ ] 6
[ ] 19
7.
[ ] 11
[ ] 12
[ ] 14
[ ] 10
8.
[ ] 6
[ ] 4
[ ] 12
[ ] 2
9.
[ ] 20 and 25
[ ] 3 and 4
[ ] 5 and 10
[ ] 15 and 20
10.
[ ] Favourite Colours in Our Class
[ ] Pets in Our Class
[ ] Favourite television programmes
[ ] Sports We Do in Year 2

You can find more about this topic by visiting BBC Bitesize - Handling data

Logo
Maths Quiz - Year 2 Data Handling - Answering Questions (Answers)
1.
[ ] By remembering what they say
[x] By tallying on the chart
[ ] By only asking the girls
[ ] By writing a story
He could tally one mark for each child in the month they tell him
2.
[ ] 7
[ ] 5
[ ] 4
[x] 9
There is a group of 5 and 4 ones tallied next to the cat
3.
[x] 6
[ ] 4
[ ] 9
[ ] 8
Four horses and two tortoises makes six animals altogether
4.
[ ] 25
[x] 27
[ ] 20
[ ] 32
The first column of pictures is not counted
5.
[ ] 1
[ ] 6
[ ] 4
[x] 9
There are 6 sharks and 3 tortoises, this is a total of 9
6.
[ ] 16
[ ] 12
[ ] 6
[x] 19
There are 16 animals on the chart. If they add 3 more, this would be 19
7.
[x] 11
[ ] 12
[ ] 14
[ ] 10
One eye represents two children, so half an eye represents one child
8.
[ ] 6
[ ] 4
[x] 12
[ ] 2
Keys are really important in graphs and charts. Each shape here stands for 2 children
9.
[ ] 20 and 25
[ ] 3 and 4
[ ] 5 and 10
[x] 15 and 20
Each group represents 5 people
10.
[ ] Favourite Colours in Our Class
[ ] Pets in Our Class
[ ] Favourite television programmes
[x] Sports We Do in Year 2
A title is always important as it helps people understand what information you’re showing