


Leading Streak Today
Your Streak Today
Leading Streak Today
Your Streak Today

Data we have recorded can be shown in tables or in charts like this.
Investigating - My Results
This quiz addresses the requirements of the National Curriculum KS1 Science for children aged 5 and 6 in years 1 and 2. Specifically this quiz is aimed at the section dealing with investigating and making simple tables and charts from the results.
This quiz is all about the results you get from investigating. Some results are best shown in a chart. We can make others into a table. Some are best written down. Can you make tables from your results? What do your results mean? What have you found out? Scientists are always trying to explain things. Can you answer all these quiz questions about investigating?
1 .
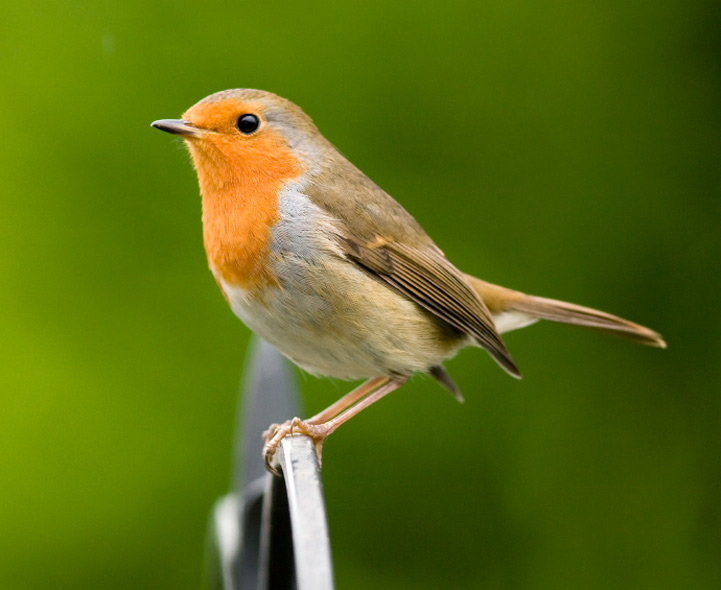
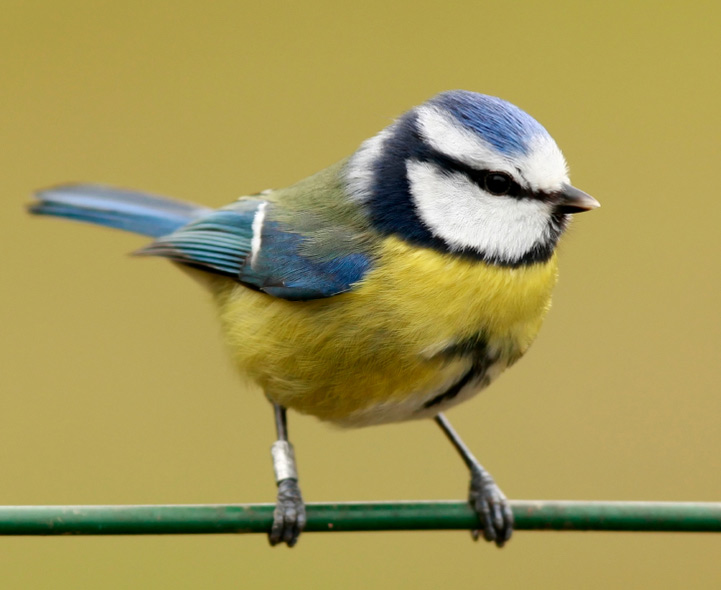
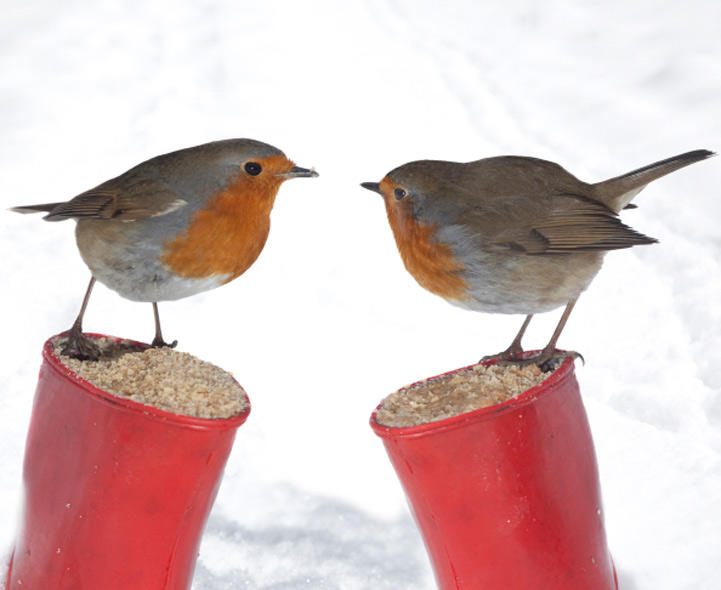
Ella counted the number of birds that came to a bird table. There were blue tits, greenfinches, and robins.
When she saw a blue tit, she coloured in a blue square.
When she saw a greenfinch, she coloured in a green square.
What colour of square did she use for a robin?
When she saw a blue tit, she coloured in a blue square.
When she saw a greenfinch, she coloured in a green square.
What colour of square did she use for a robin?
Blue
Green
Black
Red
What colour would Ella use for a goldfinch?
2 .
Ella saw three blue tits, four greenfinches, and two robins. How many blue squares did she colour in?
2
3
4
9
Which was the commonest bird?
3 .
Ella saw three blue tits, four greenfinches, and two robins. How many birds did Ella see altogether?
3
5
7
9
Which was the least common bird?
4 .
Tanya and Laura are doing an experiment. They are pouring sandy water through a filter funnel. The filter funnel has filter paper in it. What comes out at the bottom of the funnel?
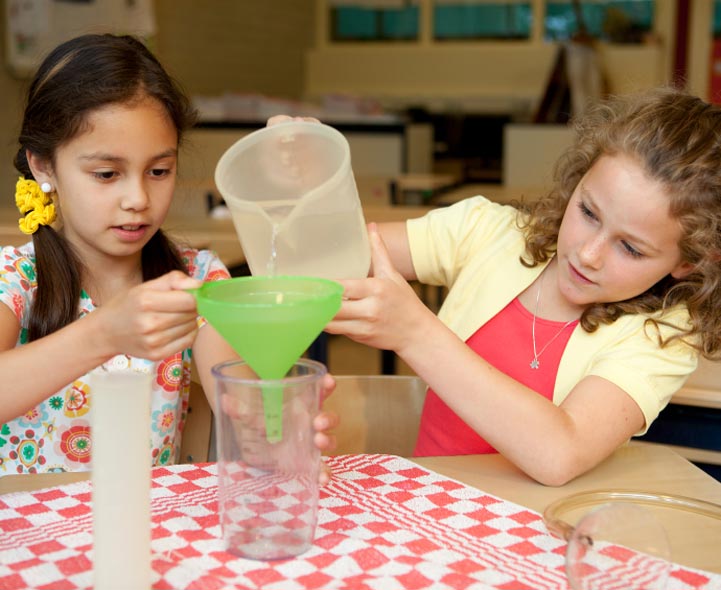
Sand and water
Just water
Just sand
Nothing
The filter paper stops the sand
5 .
Heidi looked at ten daffodils. She counted the number of petals on each daffodil. She found it was always six. What has Heidi found out?
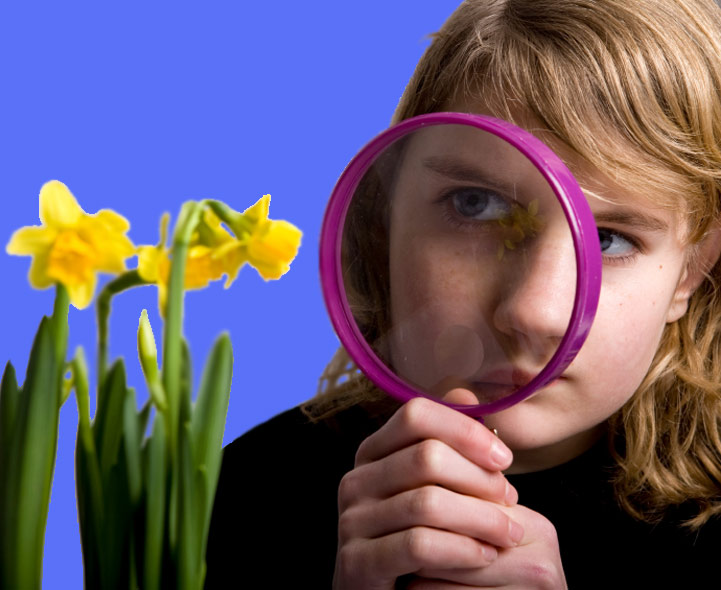
Daffodils have four petals
Daffodils have six petals
Daffodils have ten petals
Daffodils have sixteen petals
What is your favourite spring flower?
6 .
Jacob tested four materials with a magnet. Here are his results:
Rubber ball - Nothing happened
Plastic toy - Nothing happened
Metal paperclip - The magnet picked it up
Ball of wool - Nothing happened
Which one of these was attracted to the magnet?
Rubber ball - Nothing happened
Plastic toy - Nothing happened
Metal paperclip - The magnet picked it up
Ball of wool - Nothing happened
Which one of these was attracted to the magnet?

Rubber ball
Plastic toy
Metal paperclip
Ball of wool
Can you draw a picture to show Jacob’s results?
7 .
Jack wanted to know which colour of car was most popular. He counted the colours of cars at the school gate. This is how he showed his results. Jack drew a _____.

Table
Chart
Picture
Circle
Can you draw charts?
8 .
Jack put his results onto a ________. He used the ________ to draw another chart.

Computer
Television
Camera
Microscope
Can you use a computer to draw a chart?
9 .
Jack’s teacher was very pleased with the chart on the computer. She said, ‘We’ll put your chart on the display board.’ So Jack sent the chart to a _______.
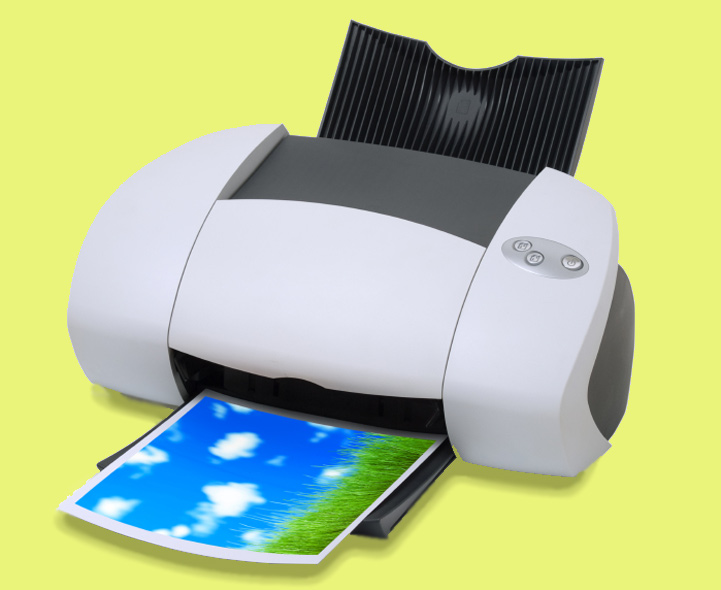
Computer
Printer
Mobile
Recorder
Do you have a display board at school? What does it show?
10 .
Jack counted the colour of cars. Here are Jack’s results:
Black - 8
Blue - 3
Green - 2
Red - 14
Silver - 9
White - 7
Yellow - 2
Which was the most popular colour of car?
Black - 8
Blue - 3
Green - 2
Red - 14
Silver - 9
White - 7
Yellow - 2
Which was the most popular colour of car?

Red
Blue
Silver
Black
Which colours of car were the least popular?


**Unlimited Quizzes Await You! 🚀**
Hey there, quiz champ! 🌟 You've already tackled today's free questions.
Ready for more?
Ready for more?
🔓 Unlock UNLIMITED Quizzes and challenge yourself every day. But that's
not all...
not all...
🔥 As a Subscriber you can join our thrilling "Daily Streak" against other
quizzers. Try to win a coveted spot on our Hall of Fame Page.
quizzers. Try to win a coveted spot on our Hall of Fame Page.
Don't miss out! Join us now and keep the fun rolling. 🎉
**Unlimited Quizzes Await You! 🚀**
Hey there, quiz champ! 🌟 You've already tackled today's free questions. Ready for more?
🔓 Unlock UNLIMITED Quizzes and challenge yourself every day. But that's not all...
🔥 As a Subscriber you can join our thrilling "Daily Streak" against other quizzers. Try to win a coveted spot on our Hall of Fame Page.
Don't miss out! Join us now and keep the fun rolling. 🎉
Here To Help
Our Social Circles
© Copyright 2016-2025 - Education Quizzes
Work Innovate Ltd - Design | Development |
Marketing