USUS UKUKIndiaIndia

Every Question Helps You Learn

Join Us
Streak
Leading Streak Today
Your Streak Today
Streak
Leading Streak Today
Your Streak Today
Atlases, Ordnance Survey
See if you can get 10 out of 10 in this quiz.

Atlases, Ordnance Survey

This Geography quiz is called 'Atlases, Ordnance Survey' and it has been written by teachers to help you if you are studying the subject at high school. Playing educational quizzes is a user-friendly way to learn if you are in the 9th or 10th grade - aged 14 to 16.

It costs only $12.50 per month to play this quiz and over 3,500 others that help you with your school work. You can subscribe on the page at Join Us

As part of your high school geography studies, you are expected to be able to use a variety of different maps, including those found in atlases and maps produced by the Ordnance Survey. You are also expected to have learned how to draw simple maps. Your knowledge of maps and mapping is one of the assessment criteria for the exams.

Maps are not a realistic representation of the world, map makers use a system of symbols to convey their information. They can take many forms, depending on its intended use. A road map, road atlas or Ordnance Survey map is intended to be used for navigation whereas the maps in a geographical atlas are intended to convey information. They have limited use for navigation as they are drawn on too small a scale.

This information provides geographers with details such as land use, population density, country boundaries, regional boundaries and political boundaries. The first known maps were made on clay tablets by the Babylonian civilization over 4000 years ago. The ancient Greeks and the Romans also had maps. In the Middle Ages, maps were generally religious and were often centered on the town of Jerusalem.

Before the invention of printing techniques, maps were all hand-drawn and extremely rare. The great age of exploration by Europeans began in the sixteenth century and the first world maps were created. It was quickly realized that representing the curved surface of the Earth on a flat two-dimensional piece of paper was difficult. In the mid-sixteenth century, the leading cartographer (a person who drew maps) Gerardus Mercator of Belgium developed a system that is still widely used today.

The accuracy of maps increased during the following centuries as more scientific surveying methods were developed. In 1747, the Ministry of Defense was called the Board of Ordnance and they began to create maps to help with more efficient troop movements. This first mapping survey took about 7 years to complete and covered only Scotland. Following this, the leader of the mapping team persuaded the Board of Ordnance to extend the mapping to cover the whole of Britain and in 1791, the Ordnance Survey was born.

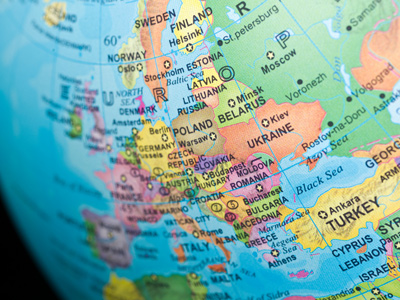
A map showing the whole world in detail would need to be very large so when you see a poster-sized map, it will only show the main features of the different countries like the main rivers, mountain ranges and capital cities. In order to show each country in more detail, maps showing the individual countries and regions are published together in an atlas. An atlas is more than just a book of maps, it includes a lot of other data too.

1.
Ordnance Survey maps cover ...
England
the USA
the whole world
Britain
The Ordnance Survey produce several different series of maps at different scales
2.
Which of the following statements most accurately describes an atlas?
A collection of maps
A list of data about the countries of the world
A navigational aid
A book containing maps and other geographical data
Each map will have a title, scale and key
3.
What is 'Mercator's Projection'?
The method used by teachers to show a map to the whole class
A way of representing the curved surface of the Earth on a flat piece of paper
A piece of rock that is sticking out from a cliff face
A special instrument for drawing a map
Countries that are further from the equator appear proportionally larger than the equatorial countries
4.
Ordnance Survey maps were first created for ...
military purposes
mountain rescue teams
people who go for country walks
car drivers
When the Ordnance Survey was started, there was a serious threat that Britain could have been invaded by the French forces of Napoleon I, so the Board of Ordnance (the equivalent of today's Ministry of Defence) needed better maps so that troops and equipment could be moved to invasion sites as efficiently as possible
5.
Which is the correct word to describe a person who is involved in preparing maps?
Mapper
Cartographer
Mapsmith
Mapographer
The word probably originates from the Latin word for 'chart'
6.
Which of the following is not a reason for using an atlas?
To find out which countries have a border with Angola
To navigate your way in mountainous terrain
To discover which country in the world had the highest population density
To learn about how land is used in South America
The scale of the maps in an atlas is too small for navigation, a tiny error in working out the direction from a small scale map would create an error of many kilometers on the mountainous terrain. Only the largest features are shown so you would not know if there was a cliff or ravine etc. that might be blocking your way
7.
On which of the following pages in an atlas might you find a hot desert marked?
North Africa, Middle East
Russia, Japan
Antarctica
Philippines and Indonesia
North Africa has the Sahara and the Middle East has the Arabian desert
8.
Which of the following could be found in an atlas
The population of New York City
A list of the world's longest rivers
Land use in the UK
All of the above
An atlas is a very good source of geographical information
9.
Which of the following most accurately describes a map?
An accurate representation of the world
A representation of part or all of the surface of the Earth
A drawing that is used only for navigation
A diagram that shows land use in Australia
Map-makers use a system of symbols to represent the features on the ground
10.
One sort of Ordnance Survey map used by hikers for navigation has a scale of 1:50,000. This means:
only 50,000 copies have ever been printed
nothing, it is just something that has to be added to the map by law
there are 50,000 different features marked on the map
every 2 centimeters measured on the map corresponds to 1 kilometer on the area represented by the map
The scale of a map is the mathematical ratio showing how much smaller it is when compared with the area it represents. In this case, 1 centimeter on the map represents 50,000 centimeters (0.5 kilometers) on the ground
Author:  Kev Woodward

© Copyright 2016-2024 - Education Quizzes
Work Innovate Ltd - Design | Development | Marketing

We use cookies to make your experience of our website better.

To comply with the new e-Privacy directive, we need to ask for your consent - I agree - No thanks - Find out more