


Ask the AI Tutor
Need help with Year 2 Data Handling - Answering Questions? Ask our AI Tutor!
AI Tutor - Lucy
Connecting with Tutor...
Please wait while we establish connection
I have 3 red cars, 5 yellow, 6 blue, 2 green and 1 pink. How could I show this information?
Year 2 Data Handling - Answering Questions
Read charts and pictograms like a detective. Spot words such as total and how many more, then use the data to choose and explain your answer.
Question 1
By remembering what they say
By tallying on the chart
By only asking the girls
By writing a story
He could tally one mark for each child in the month they tell him
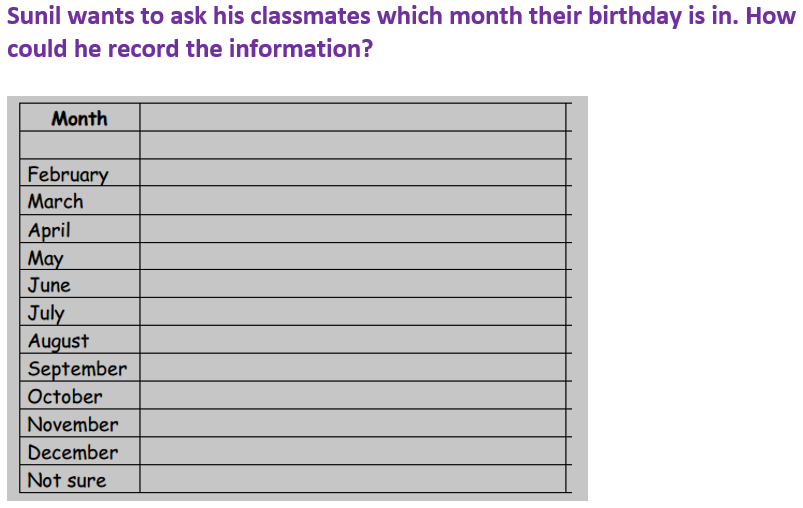
Question 2
7
5
4
9
There is a group of 5 and 4 ones tallied next to the cat
Question 3
6
4
9
8
Four horses and two tortoises makes six animals altogether
Question 4
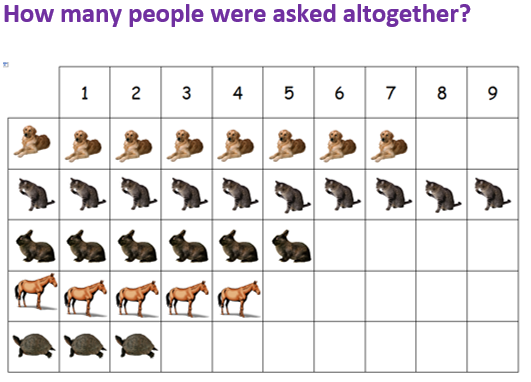
25
27
20
32
The first column of pictures is not counted
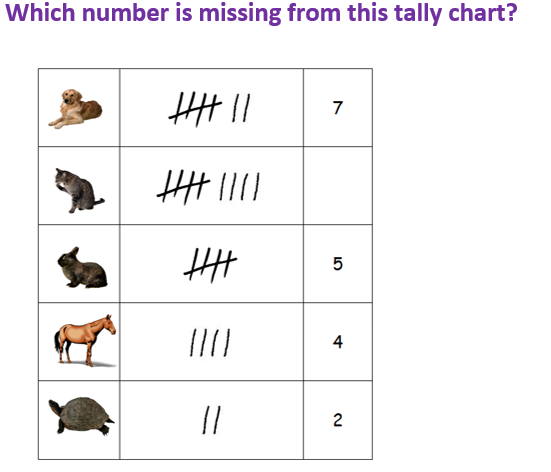
Question 5

1
6
4
9
There are 6 sharks and 3 tortoises, this is a total of 9
Question 6
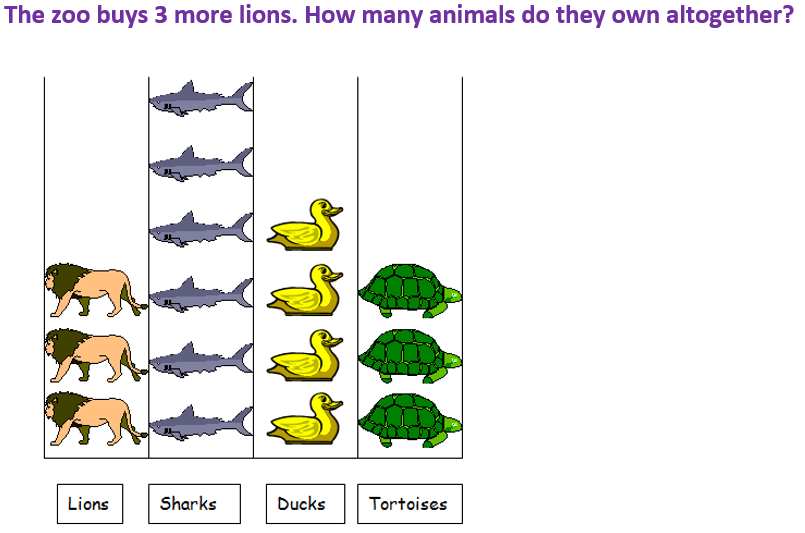
16
12
6
19
There are 16 animals on the chart. If they add 3 more, this would be 19
Question 7
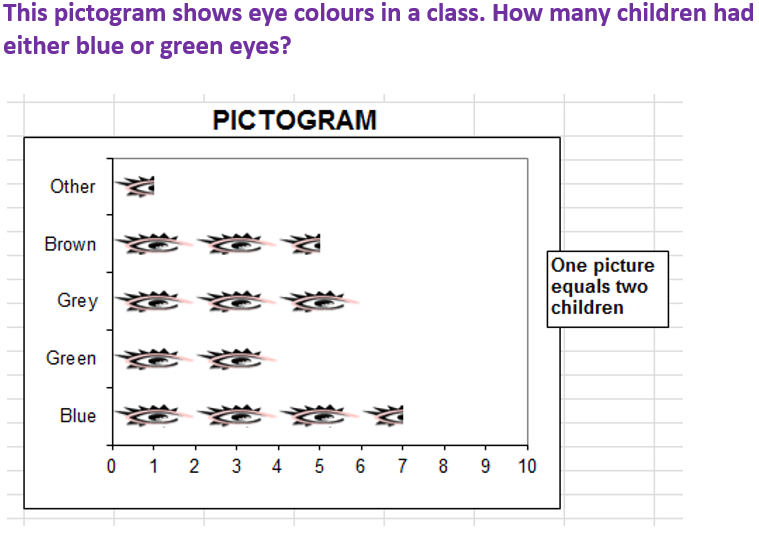
11
12
14
10
One eye represents two children, so half an eye represents one child
Question 8
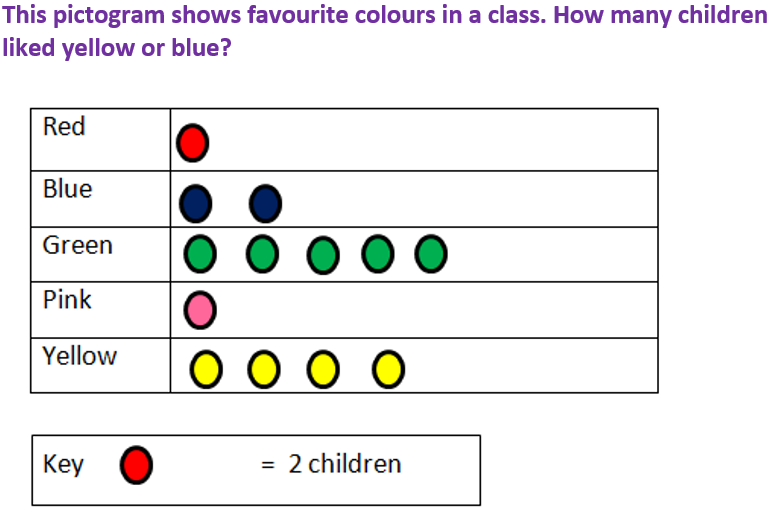
6
4
12
2
Keys are really important in graphs and charts. Each shape here stands for 2 children
Question 9
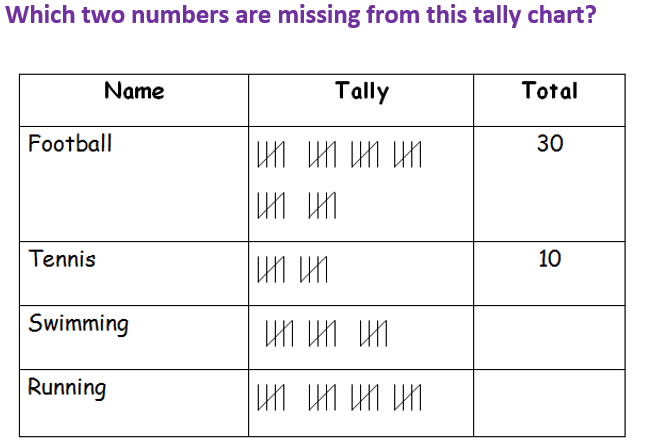
20 and 25
3 and 4
5 and 10
15 and 20
Each group represents 5 people
Question 10
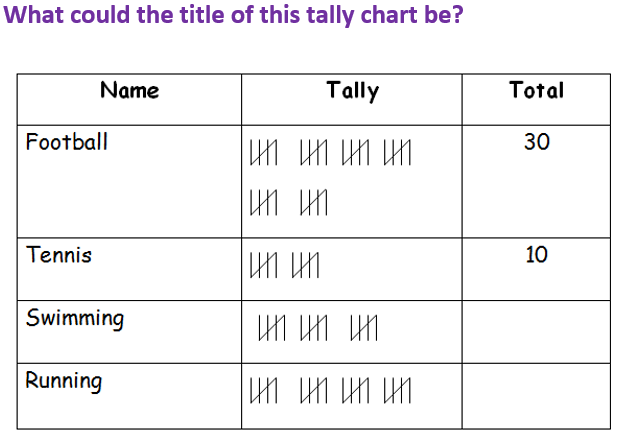
Favourite Colours in Our Class
Pets in Our Class
Favourite television programmes
Sports We Do in Year 2
A title is always important as it helps people understand what information you’re showing


**Unlimited Quizzes Await You! 🚀**
Hey there, quiz champ! 🌟 You've already tackled today's free questions.
Ready for more?
Ready for more?
🔓 Unlock UNLIMITED Quizzes and challenge yourself every day. But that's
not all...
not all...
🔥 As a Subscriber you can join our thrilling "Daily Streak" against other
quizzers. Try to win a coveted spot on our Hall of Fame Page.
quizzers. Try to win a coveted spot on our Hall of Fame Page.
Don't miss out! Join us now and keep the fun rolling. 🎉
**Unlimited Quizzes Await You! 🚀**
Hey there, quiz champ! 🌟 You've already tackled today's free questions. Ready for more?
🔓 Unlock UNLIMITED Quizzes and challenge yourself every day. But that's not all...
🔥 As a Subscriber you can join our thrilling "Daily Streak" against other quizzers. Try to win a coveted spot on our Hall of Fame Page.
Don't miss out! Join us now and keep the fun rolling. 🎉
© Copyright 2016-2026 - Education Quizzes
Work Innovate Ltd - Design | Development |
Marketing