


Ask the AI Tutor
Need help with Year 2 Data Handling - Interpreting Data? Ask our AI Tutor!
AI Tutor - Lucy
Connecting with Tutor...
Please wait while we establish connection

Data Handling is all about using data and results.
Year 2 Data Handling - Interpreting Data
Learn to read charts and pictograms. Estimate first, then count carefully to check. Spot totals, the biggest group, and the difference between categories.
To see a larger image, click on the picture.
Question 1
This pie chart shows the colours of swimming costumes in a class. What is the most popular colour?
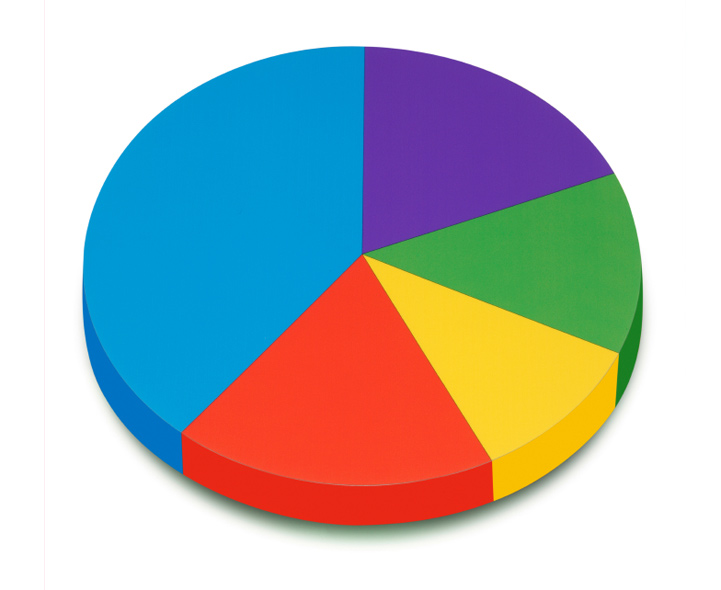
Red
Green
Blue
Purple
The largest section of the 'pie' is blue, so this is most popular
Question 2
Sam measured himself every month for a year and wrote his results in a table.
What would you expect to see?
What would you expect to see?

Sam's start height was more than his height at the end of the year
Sam stayed the same height all year
Sam's height changed by over 2m
Sam's start height was shorter than his height a year later
Most children grow at least a few centimetres each year
Question 3
The teacher tallied the quality of homework handed in by her class. How many children handed in 'Good' or 'Excellent' homework?
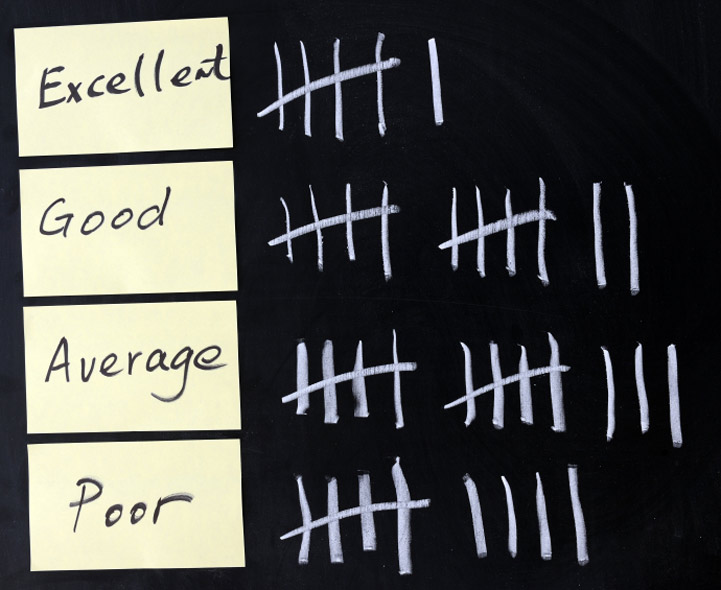
18
25
22
12
Excellent got 6 and Good got 12
Question 4
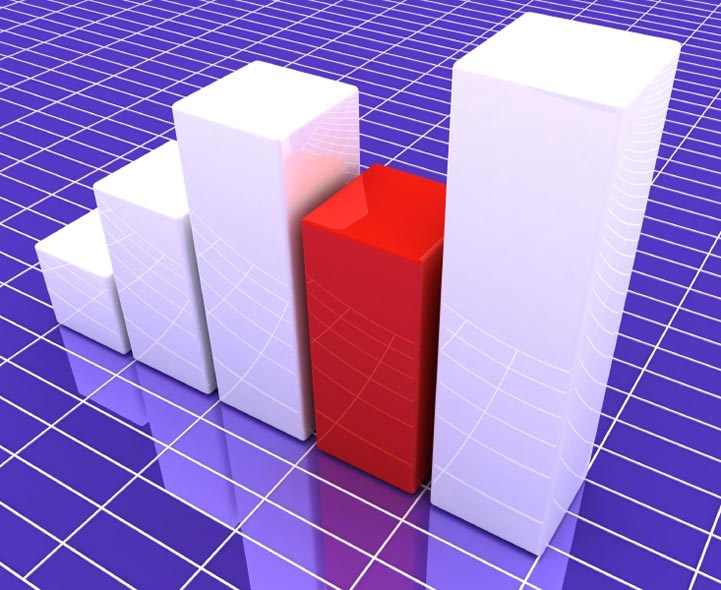
Sam is struggling to read his bar chart. He has labelled the numbers at the side, but what else should he have done?

Label each bar along the bottom
Coloured them in neatly
Made all the bars bigger to see them clearly
Turned the graph upside down
Labelling the information on a graph is really helpful for anyone trying to understand it
Question 5
Zak wants to ask his friends about their favourite TV programmes. How could he organise the information?

He could send them all a letter
He should just try to remember everyone's answers
He could write a story about it
In a table so he can tally
The table could have a space for the child's name, and a list of five or six programmes to choose from
Question 6
When we look at tables, graphs and tallying, it is called...
Data Maths
Data Grouping
Data Drawing
Data Handling
Data Handling covers all the work in maths about using data and results
Question 7
This graph shows favourite colours in a class. What was the least favourite colour?
Yellow
Blue
Orange
Red
Yellow is the shortest bar and red was the most popular colour
Question 8
What kind of chart might you use to show the different eye colours in the class?

A pictogram - one pair of eyes for each child
A line graph
A chart
Tallying
A pictogram is a clear visual way of presenting information
Question 9
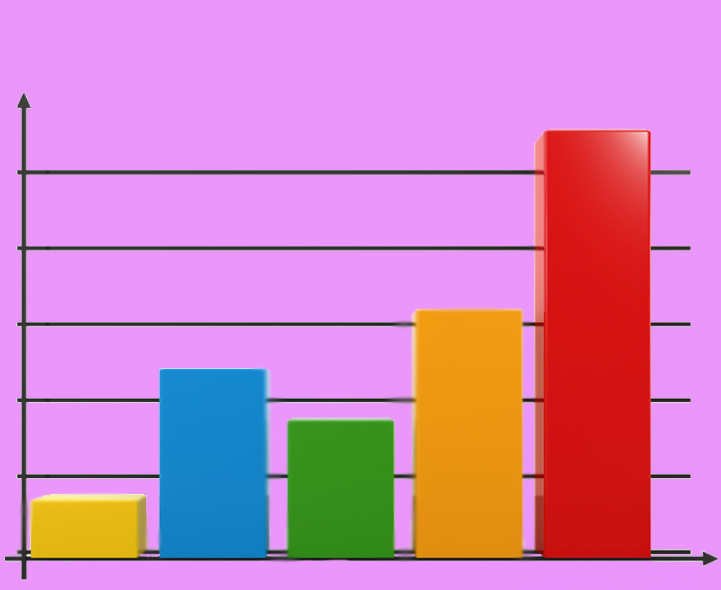
Which colour has the highest value in this bar chart?
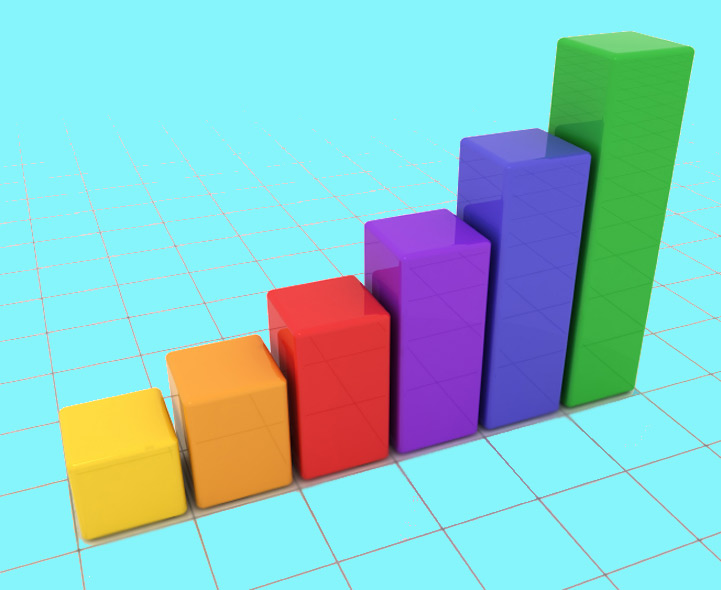
Red
Purple
Green
Yellow
The green bar is the tallest so it must have the highest value
Question 10
How much has been tallied here?
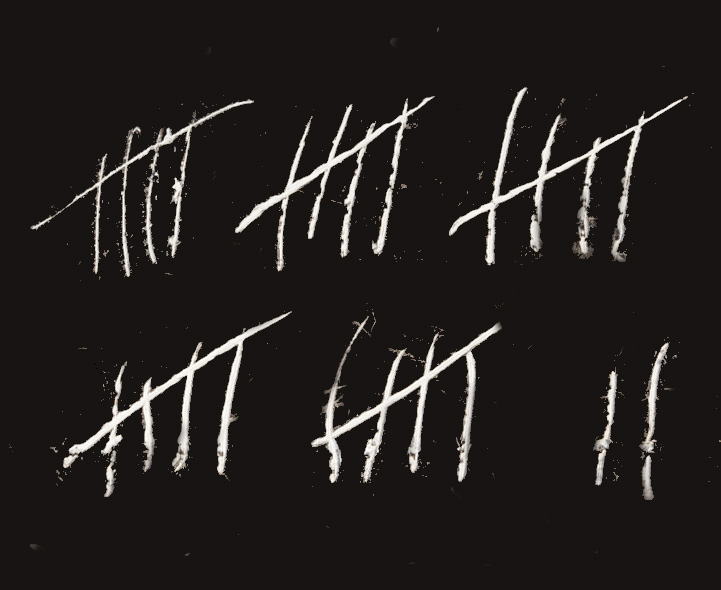
18
22
27
20
Each group is a group of 5 when we tally


**Unlimited Quizzes Await You! 🚀**
Hey there, quiz champ! 🌟 You've already tackled today's free questions.
Ready for more?
Ready for more?
🔓 Unlock UNLIMITED Quizzes and challenge yourself every day. But that's
not all...
not all...
🔥 As a Subscriber you can join our thrilling "Daily Streak" against other
quizzers. Try to win a coveted spot on our Hall of Fame Page.
quizzers. Try to win a coveted spot on our Hall of Fame Page.
Don't miss out! Join us now and keep the fun rolling. 🎉
**Unlimited Quizzes Await You! 🚀**
Hey there, quiz champ! 🌟 You've already tackled today's free questions. Ready for more?
🔓 Unlock UNLIMITED Quizzes and challenge yourself every day. But that's not all...
🔥 As a Subscriber you can join our thrilling "Daily Streak" against other quizzers. Try to win a coveted spot on our Hall of Fame Page.
Don't miss out! Join us now and keep the fun rolling. 🎉
© Copyright 2016-2026 - Education Quizzes
Work Innovate Ltd - Design | Development |
Marketing